Electronics R US: Location & Performance Dashboard
An interactive map‑based dashboard for tracking shipping metrics, profit, cost, and payment methods across US states — with real‑time filtering and drill‑down capability.
Project overview
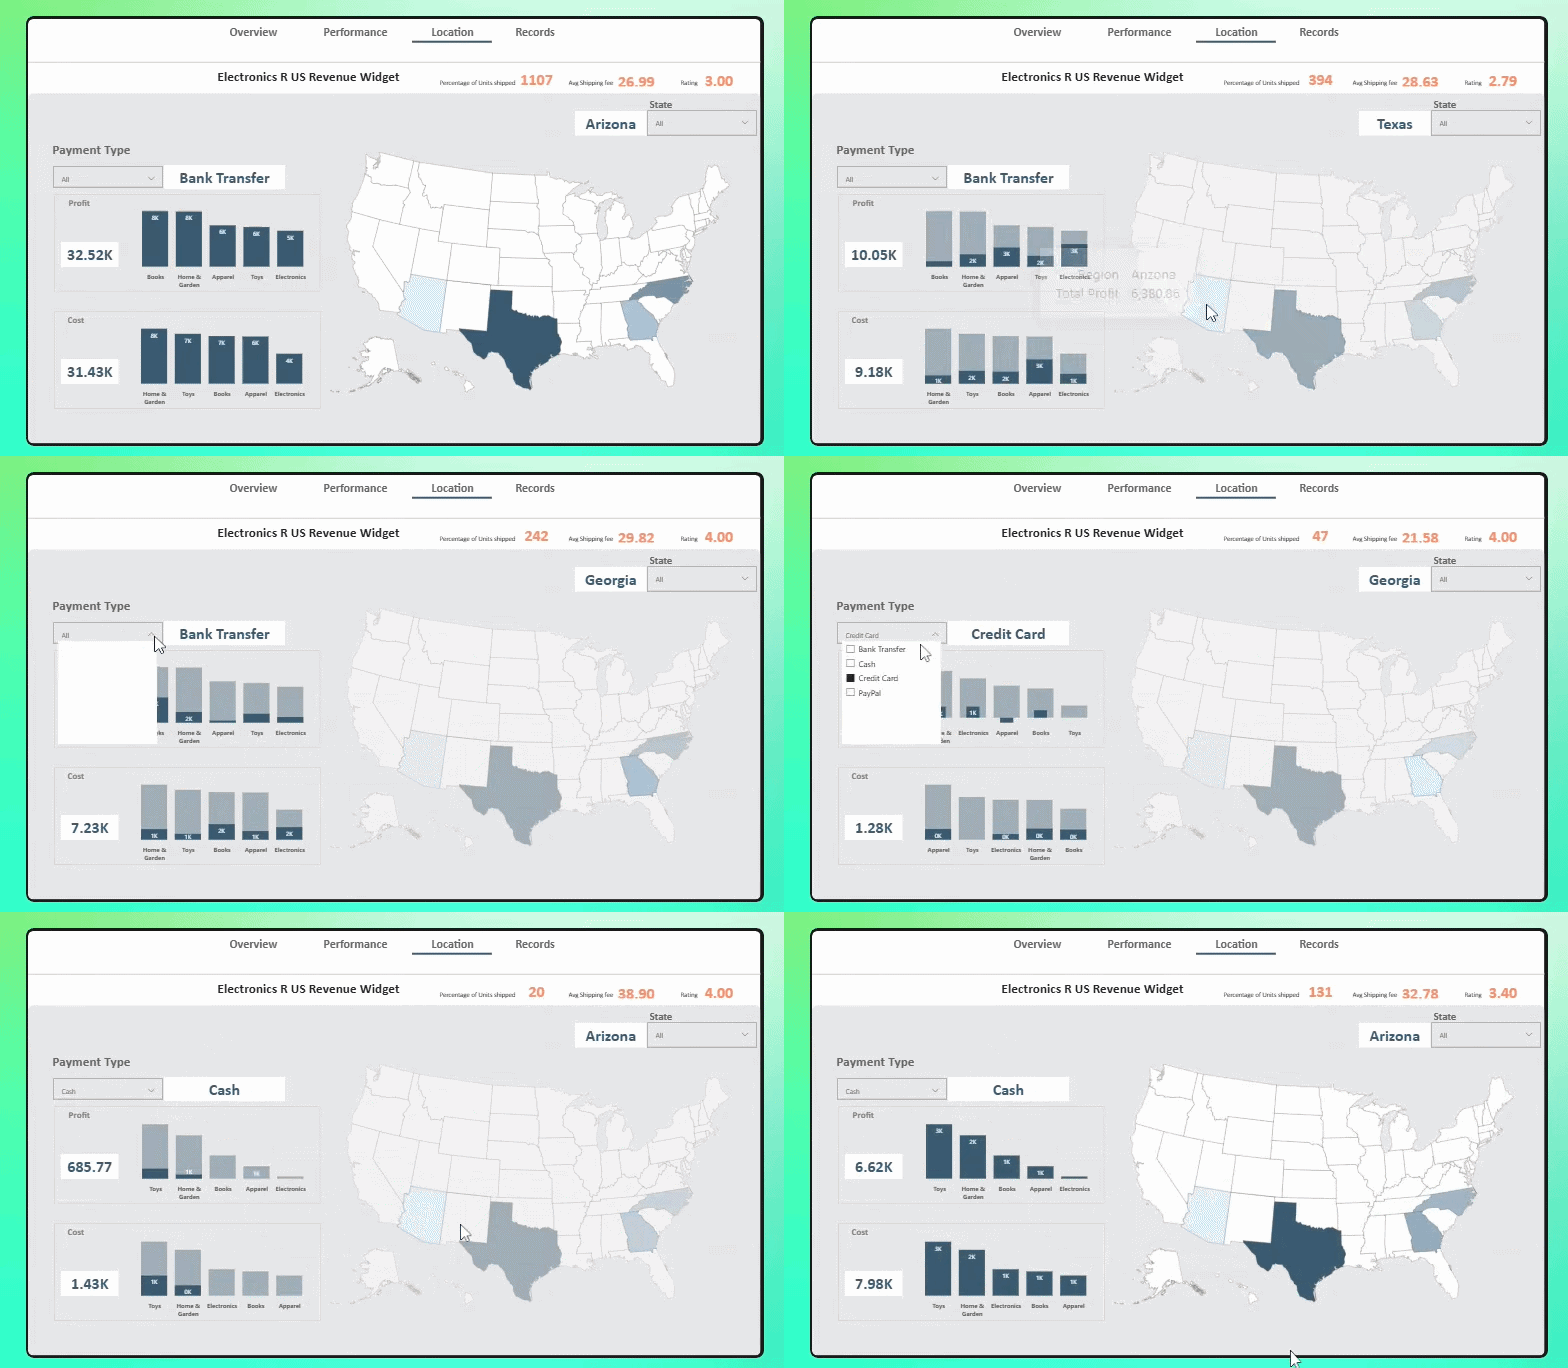
This interactive map dashboard brings together location data and business metrics in a single, scannable view. Designed for Electronics R US, it enables quick assessment of shipping, profit, and payment patterns across US states. The dashboard answers critical operational questions: Where are we shipping most? Which payment methods are preferred? How do profit and cost vary by location?
Key metrics displayed include Units Shipped (1,107), Average Shipping Fee ($26.99), Rating (3.0), Profit ($32.52K), Cost ($31.43K), and Payment Type (Bank Transfer). The dashboard features interactive tabs for Overview, Performance, Location, and Records views, along with state-level filtering.
This project demonstrates how location intelligence can transform operational analysis, making it easier for business leaders to identify regional trends and optimize logistics.
Approach & tools
Tools: Power BI · Map visualization · KPI cards
Techniques: Interactive filtering · Tab navigation · Location intelligence · Real-time drill-down
Approach: The dashboard was designed with a map-first approach, using location as the primary lens for analysis. Interactive tabs organize content without clutter, while state-level filtering drives all visualizations. KPI cards display the most important metrics prominently for quick decision-making.
Project impact
This dashboard enables operations teams to monitor shipping volumes and costs by region, sales leadership to track profit and performance across states, and logistics teams to optimize shipping fees based on location patterns. By providing a geographic view of business performance, the dashboard helps stakeholders make faster, more informed decisions about resource allocation and operational strategy.
The map-based approach has proven valuable for identifying regional outliers, spotting growth opportunities in underperforming states, and understanding payment preference patterns across different geographic areas.
Explore the map dashboard
See how location intelligence can transform operational analysis — view the complete dashboard or adapt it for your own geography-based data.
Start a conversation
Have a data question or project in mind?
Let's talk about the problem you're trying to solve and how data can help.