Average Revenue & Regional Performance Data Widget
Interactive Widget for tracking revenue trends across Australian states, with a 43% outperformance insight. Built in Power BI.
Project overview
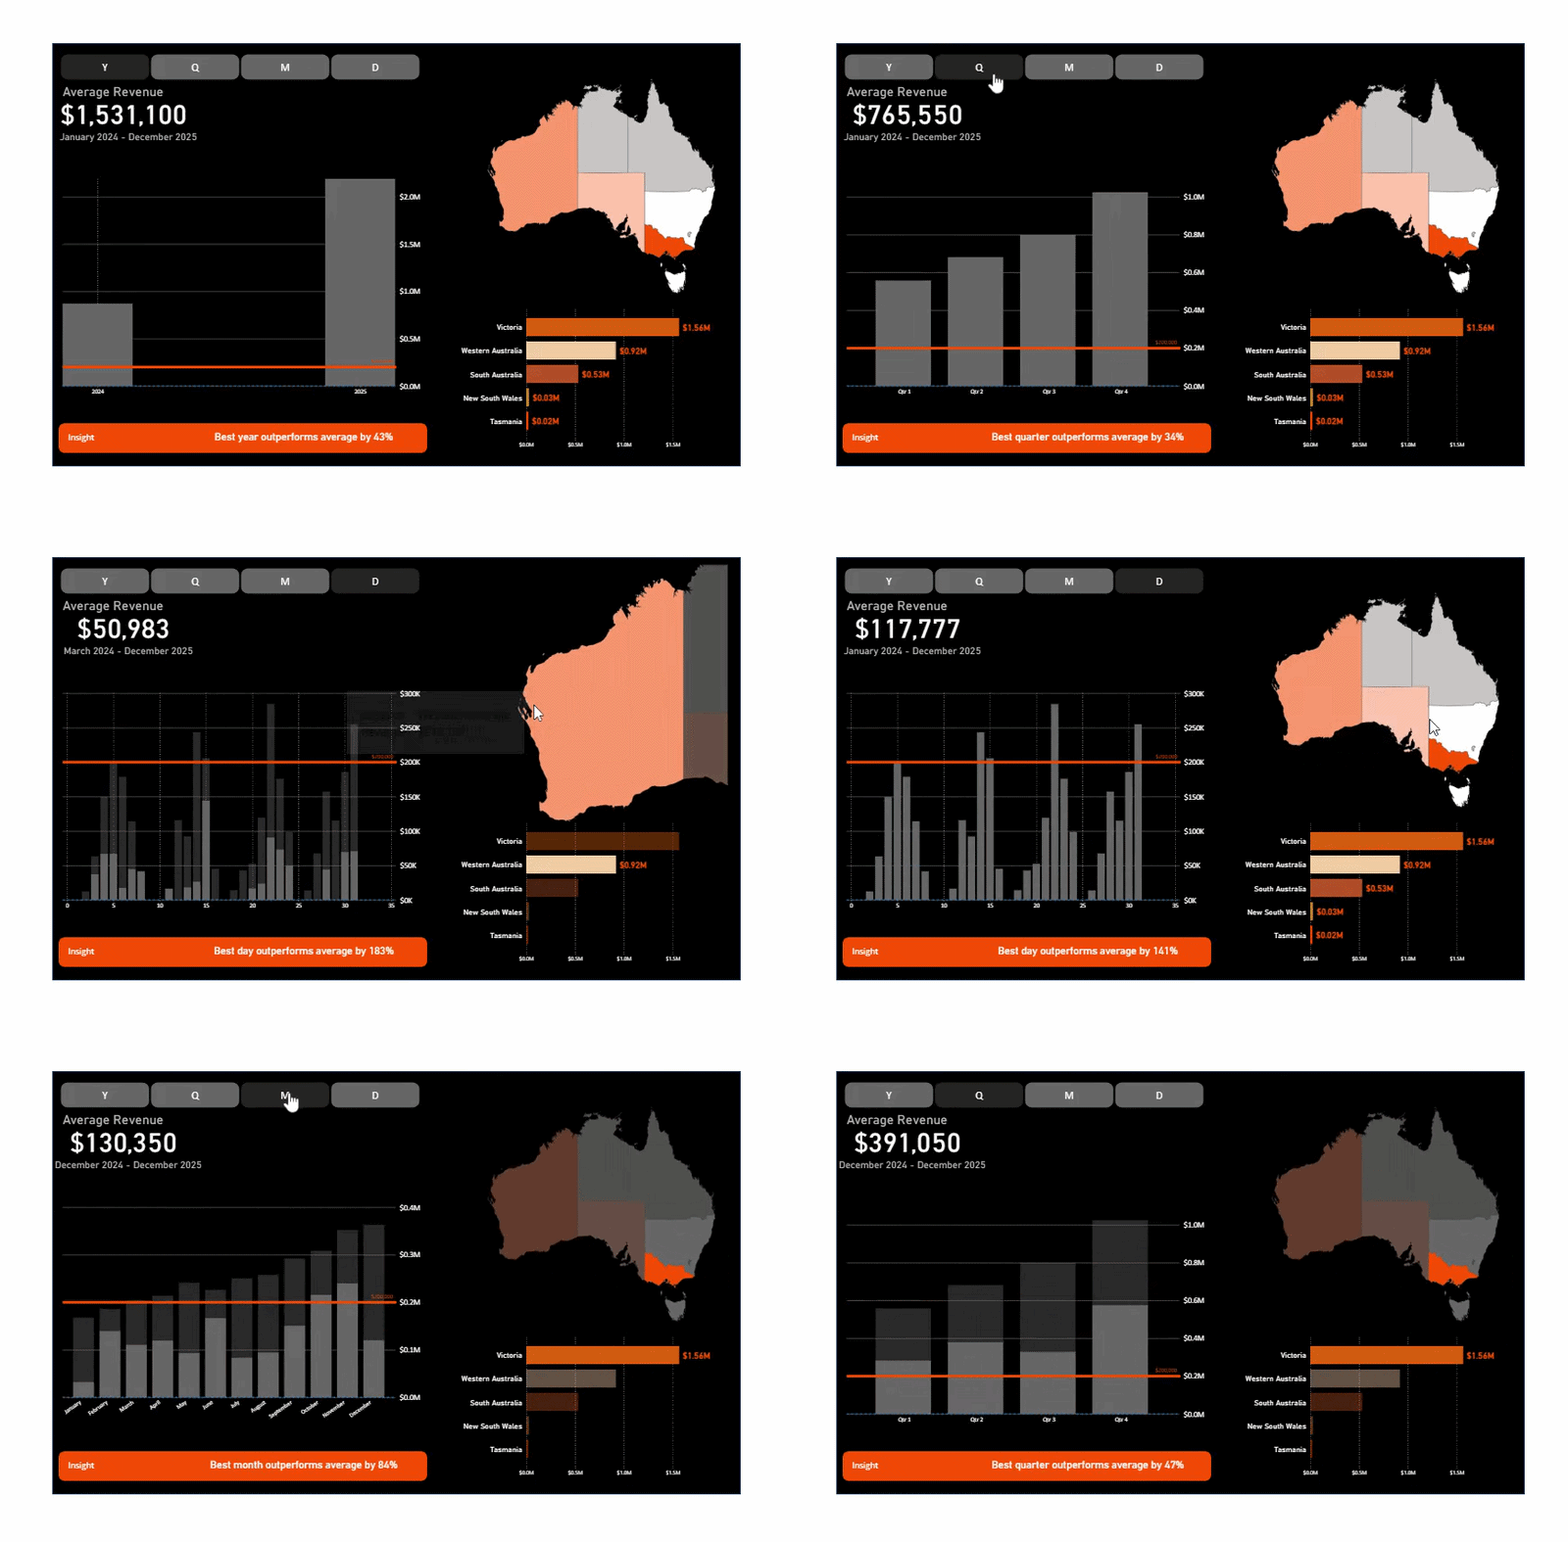
This Power BI data widget visualizes revenue performance across Australian states from January 2024 to December 2025. It highlights the average revenue of $1.53M, year-over-year trends, and regional breakdowns — with a clear insight that the best year outperforms the average by 43%.
Built to help stakeholders quickly grasp regional disparities and seasonal patterns, the dashboard combines a time-series line chart, a state‑by‑state bar chart, and a high‑level KPI card.
Key metrics tracked
- Average Revenue: $1,531,100 (January 2024 - December 2025)
- Regional Performance: Victoria ($1.56M), Western Australia ($0.92M), South Australia ($0.53M), New South Wales ($0.03M), Tasmania ($0.02M)
- Year-over-Year Trend: 2024 vs 2025 comparison with 43% outperformance
- Insight: Best year outperforms average by 43%
Tools & approach
Power BI · Google Sheets · Data blending · Calculated fields · Custom date ranges
Explore the dashboard
View the interactive version or clone the template to adapt for your own revenue data.
Start a conversation
Have a data question or project in mind?
Let's talk about the problem you're trying to solve and how data can help.