Power BI dashboard: Analyzing Africa's Tech Funding Landscape
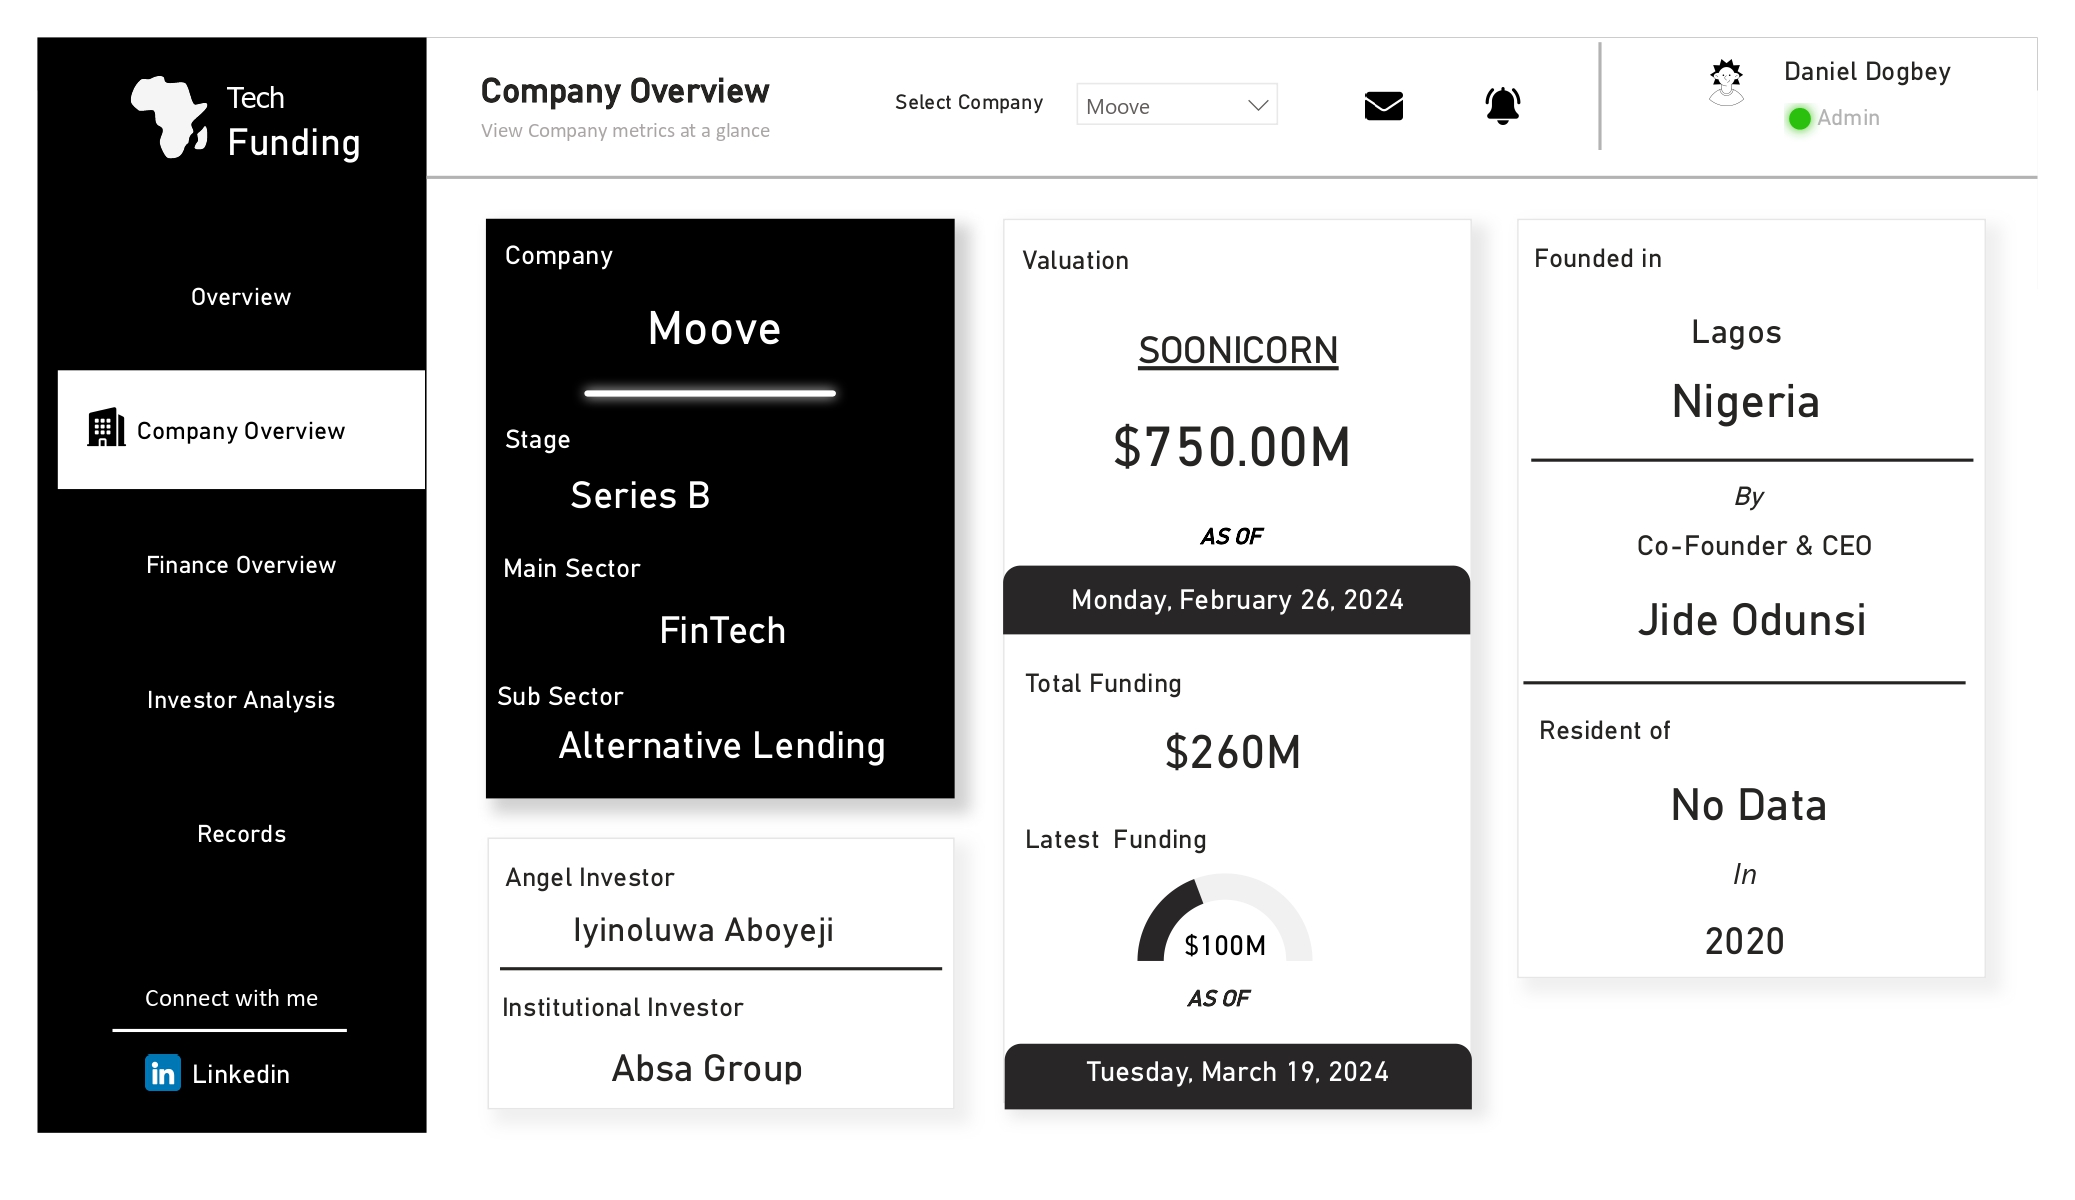
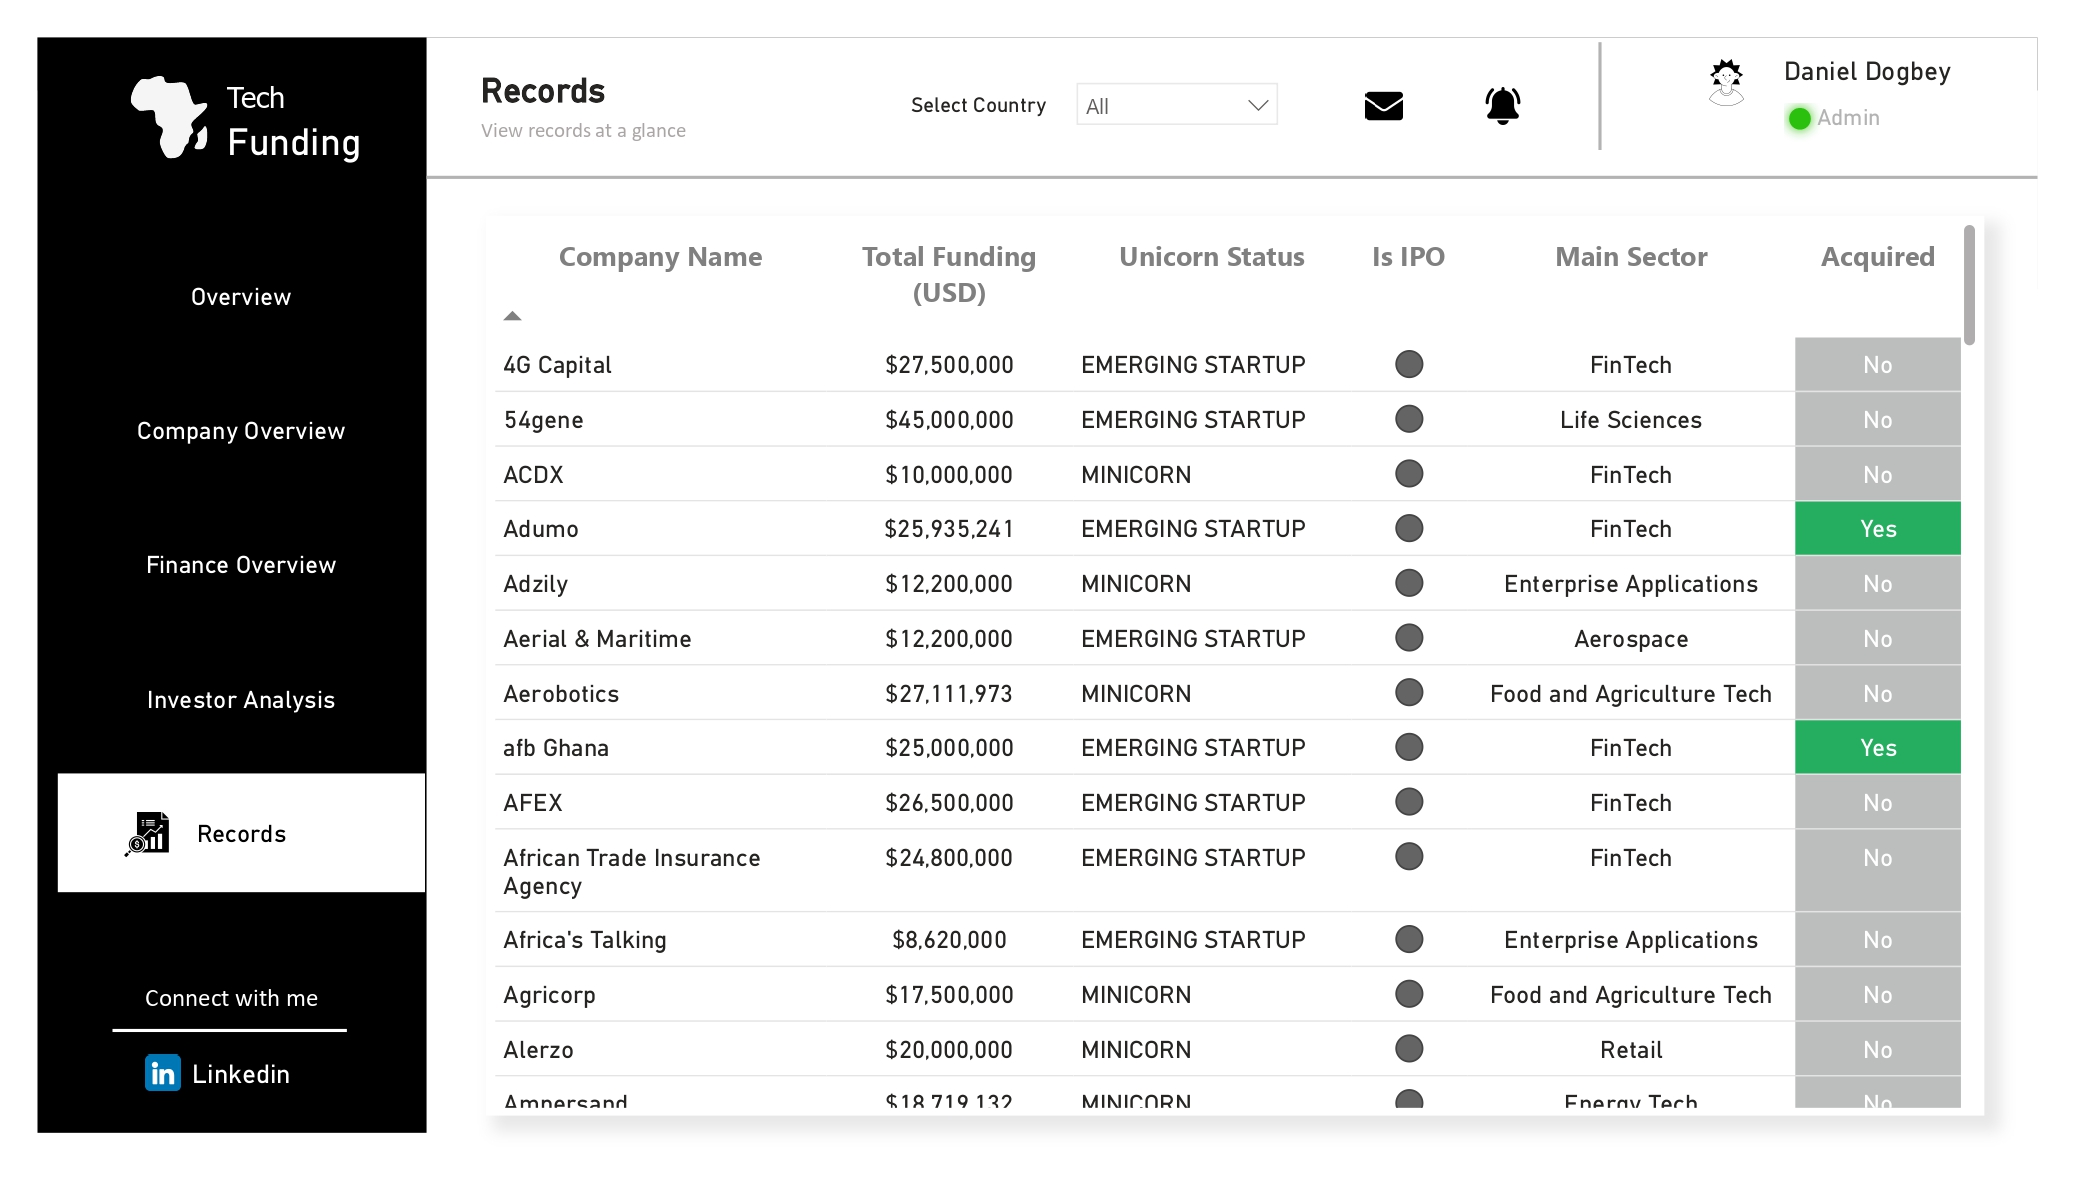
This Power BI dashboard provides an in-depth analysis of Africa's tech funding landscape from 2010 to 2023. It highlights key metrics, including $13.6B in total funding, $7.14B in latest sector funding, and the dominance of Life Sciences with $2.1B in recent investments. Explore sectoral trends, funding distribution, and insights into investor impact across the continent.

Project overview
This Power BI dashboard provides an in-depth analysis of Africa's tech funding landscape from 2010 to 2023. It highlights key metrics, including $13.6B in total funding, $7.14B in latest sector funding, and the dominance of Life Sciences with $2.1B in recent investments. Explore sectoral trends, funding distribution, and insights into investor impact across the continent.
Key Insights:
Approach & tools
Data Analysis · Visualization
Project impact
Informed Investment Decisions: Enabled stakeholders to identify high-performing sectors and allocate resources effectively. Enhanced Data Accessibility: Delivered a user-friendly dashboard that distilled complex data into actionable insights for both technical and non-technical audiences. Strategic Planning Support: Provided a comprehensive view of funding patterns to guide strategic business and policy planning.
Explore the work
Open the project repository to review the analysis, notebooks, SQL, dashboards, or supporting files.
Start a conversation
Have a data question or project in mind?
Let's talk about the problem you're trying to solve and how data can help.