Ads Campaign Dashboard
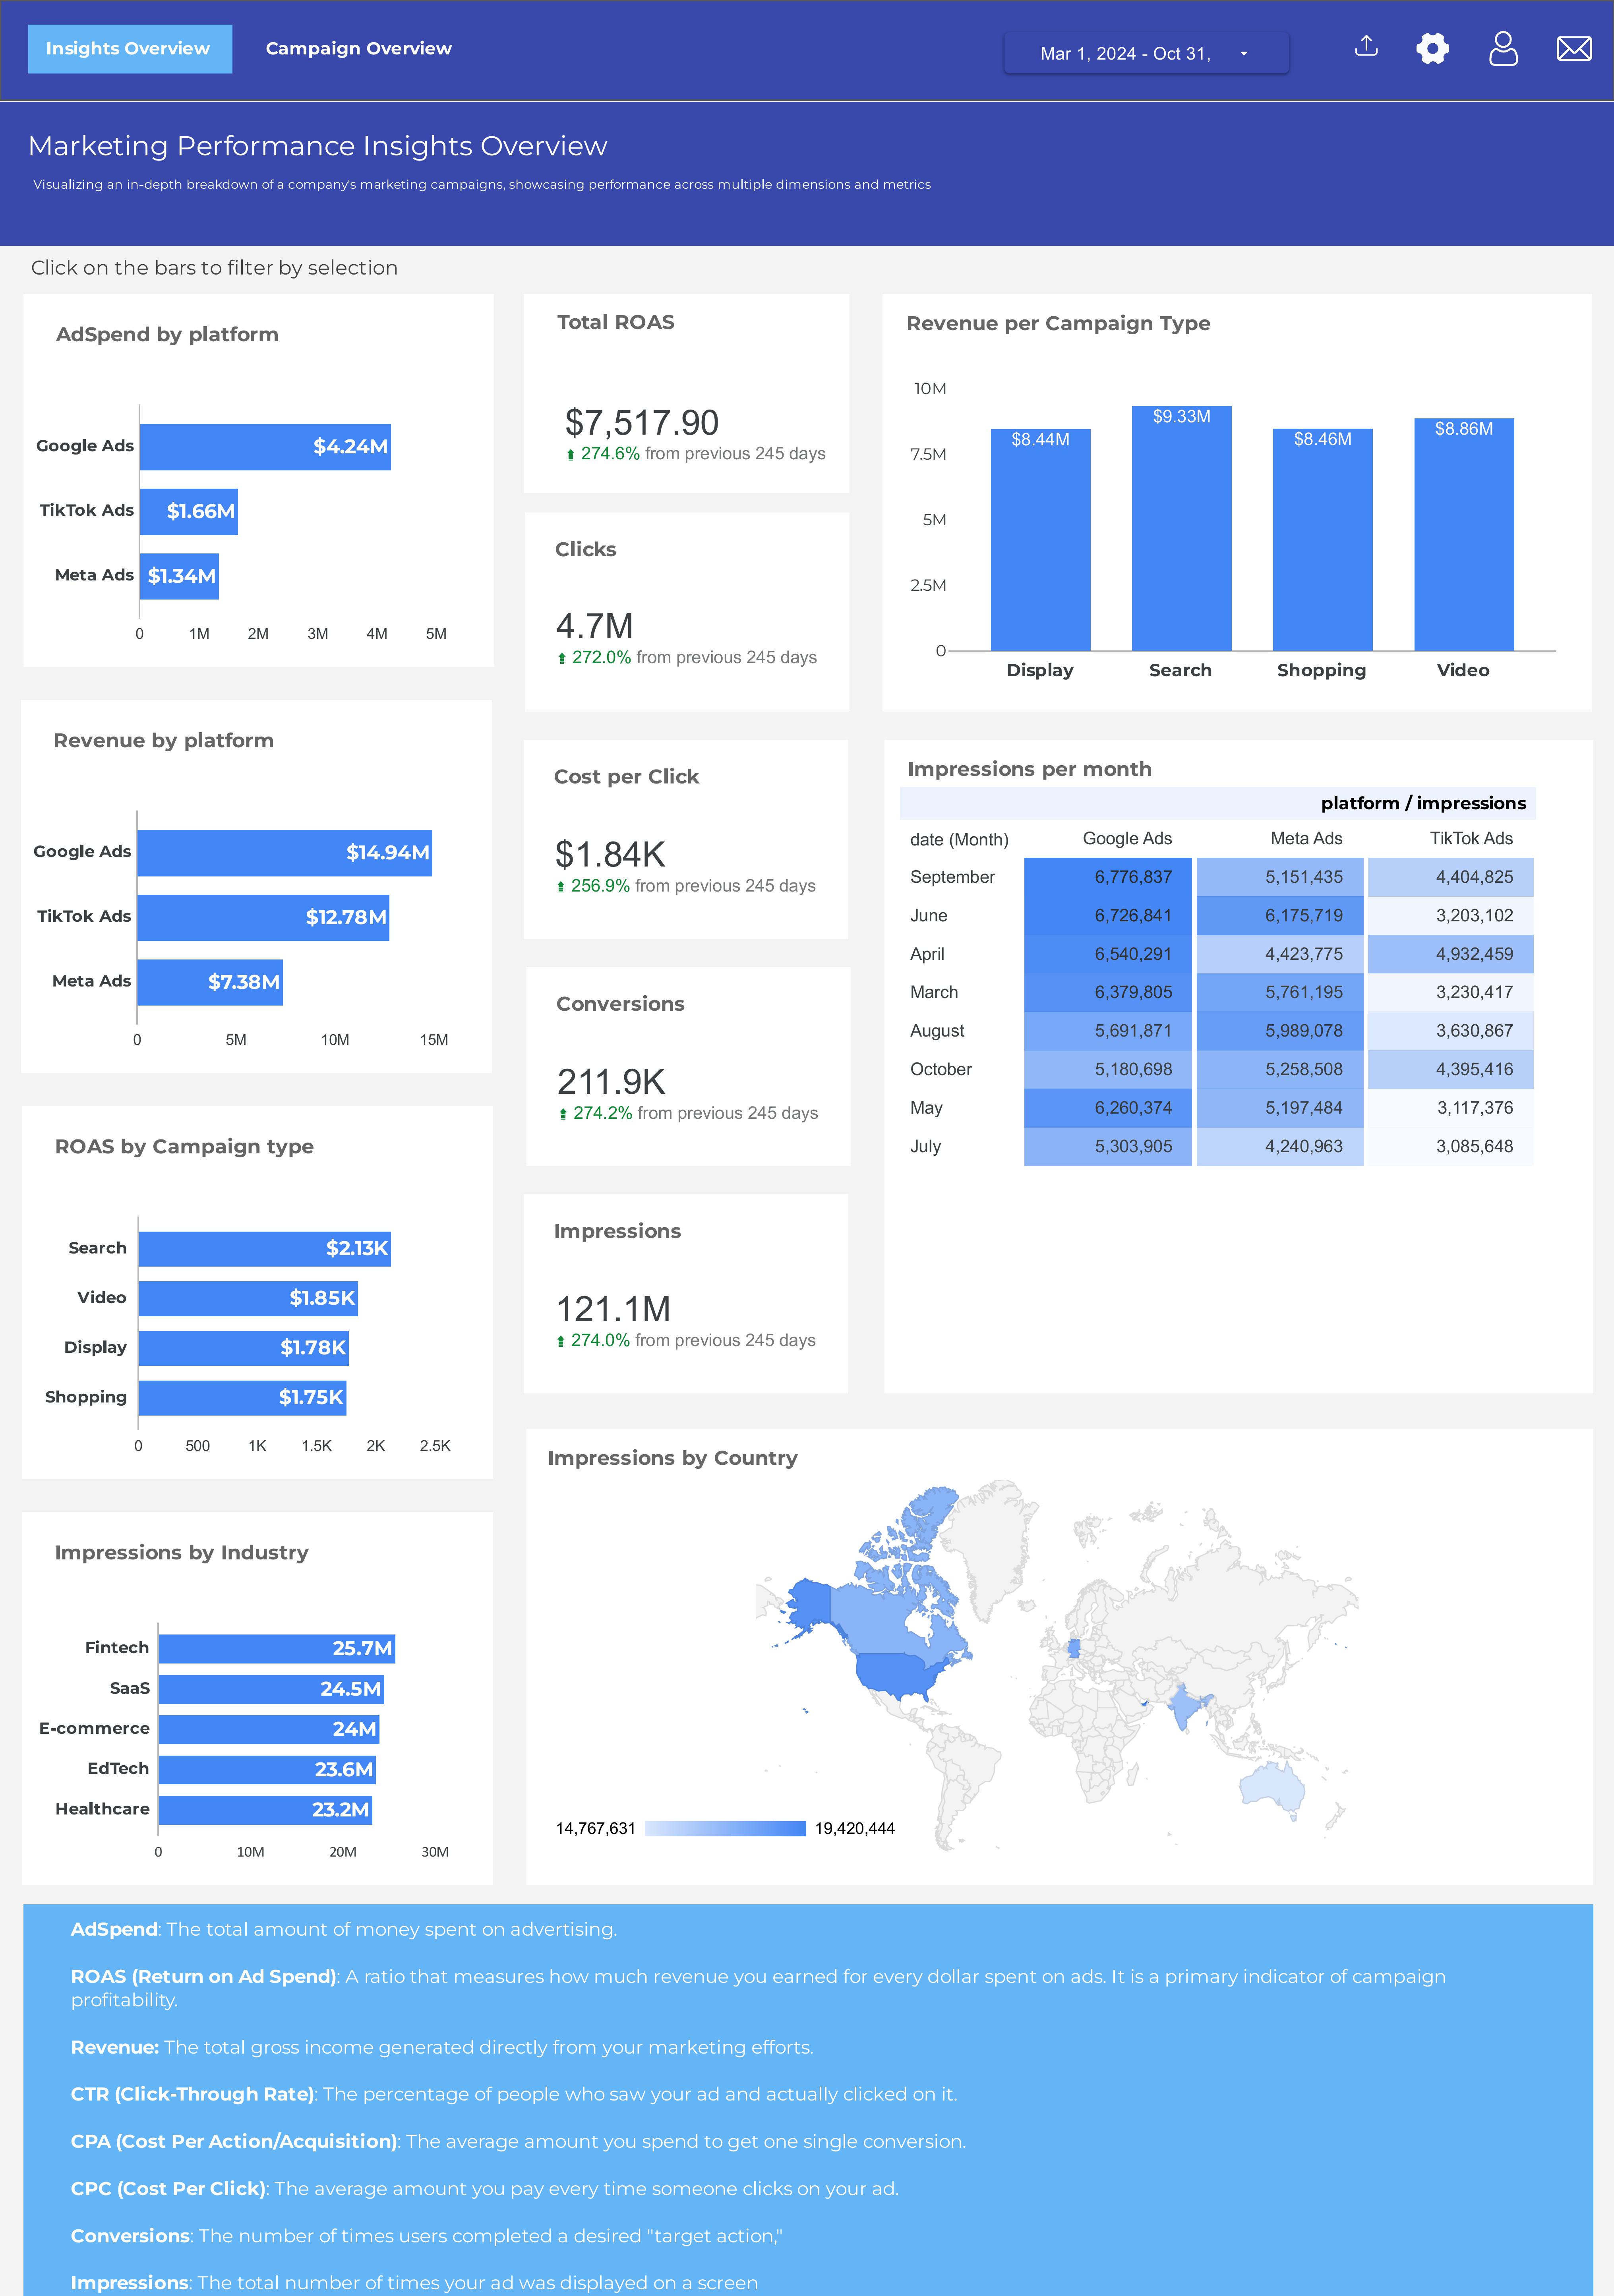
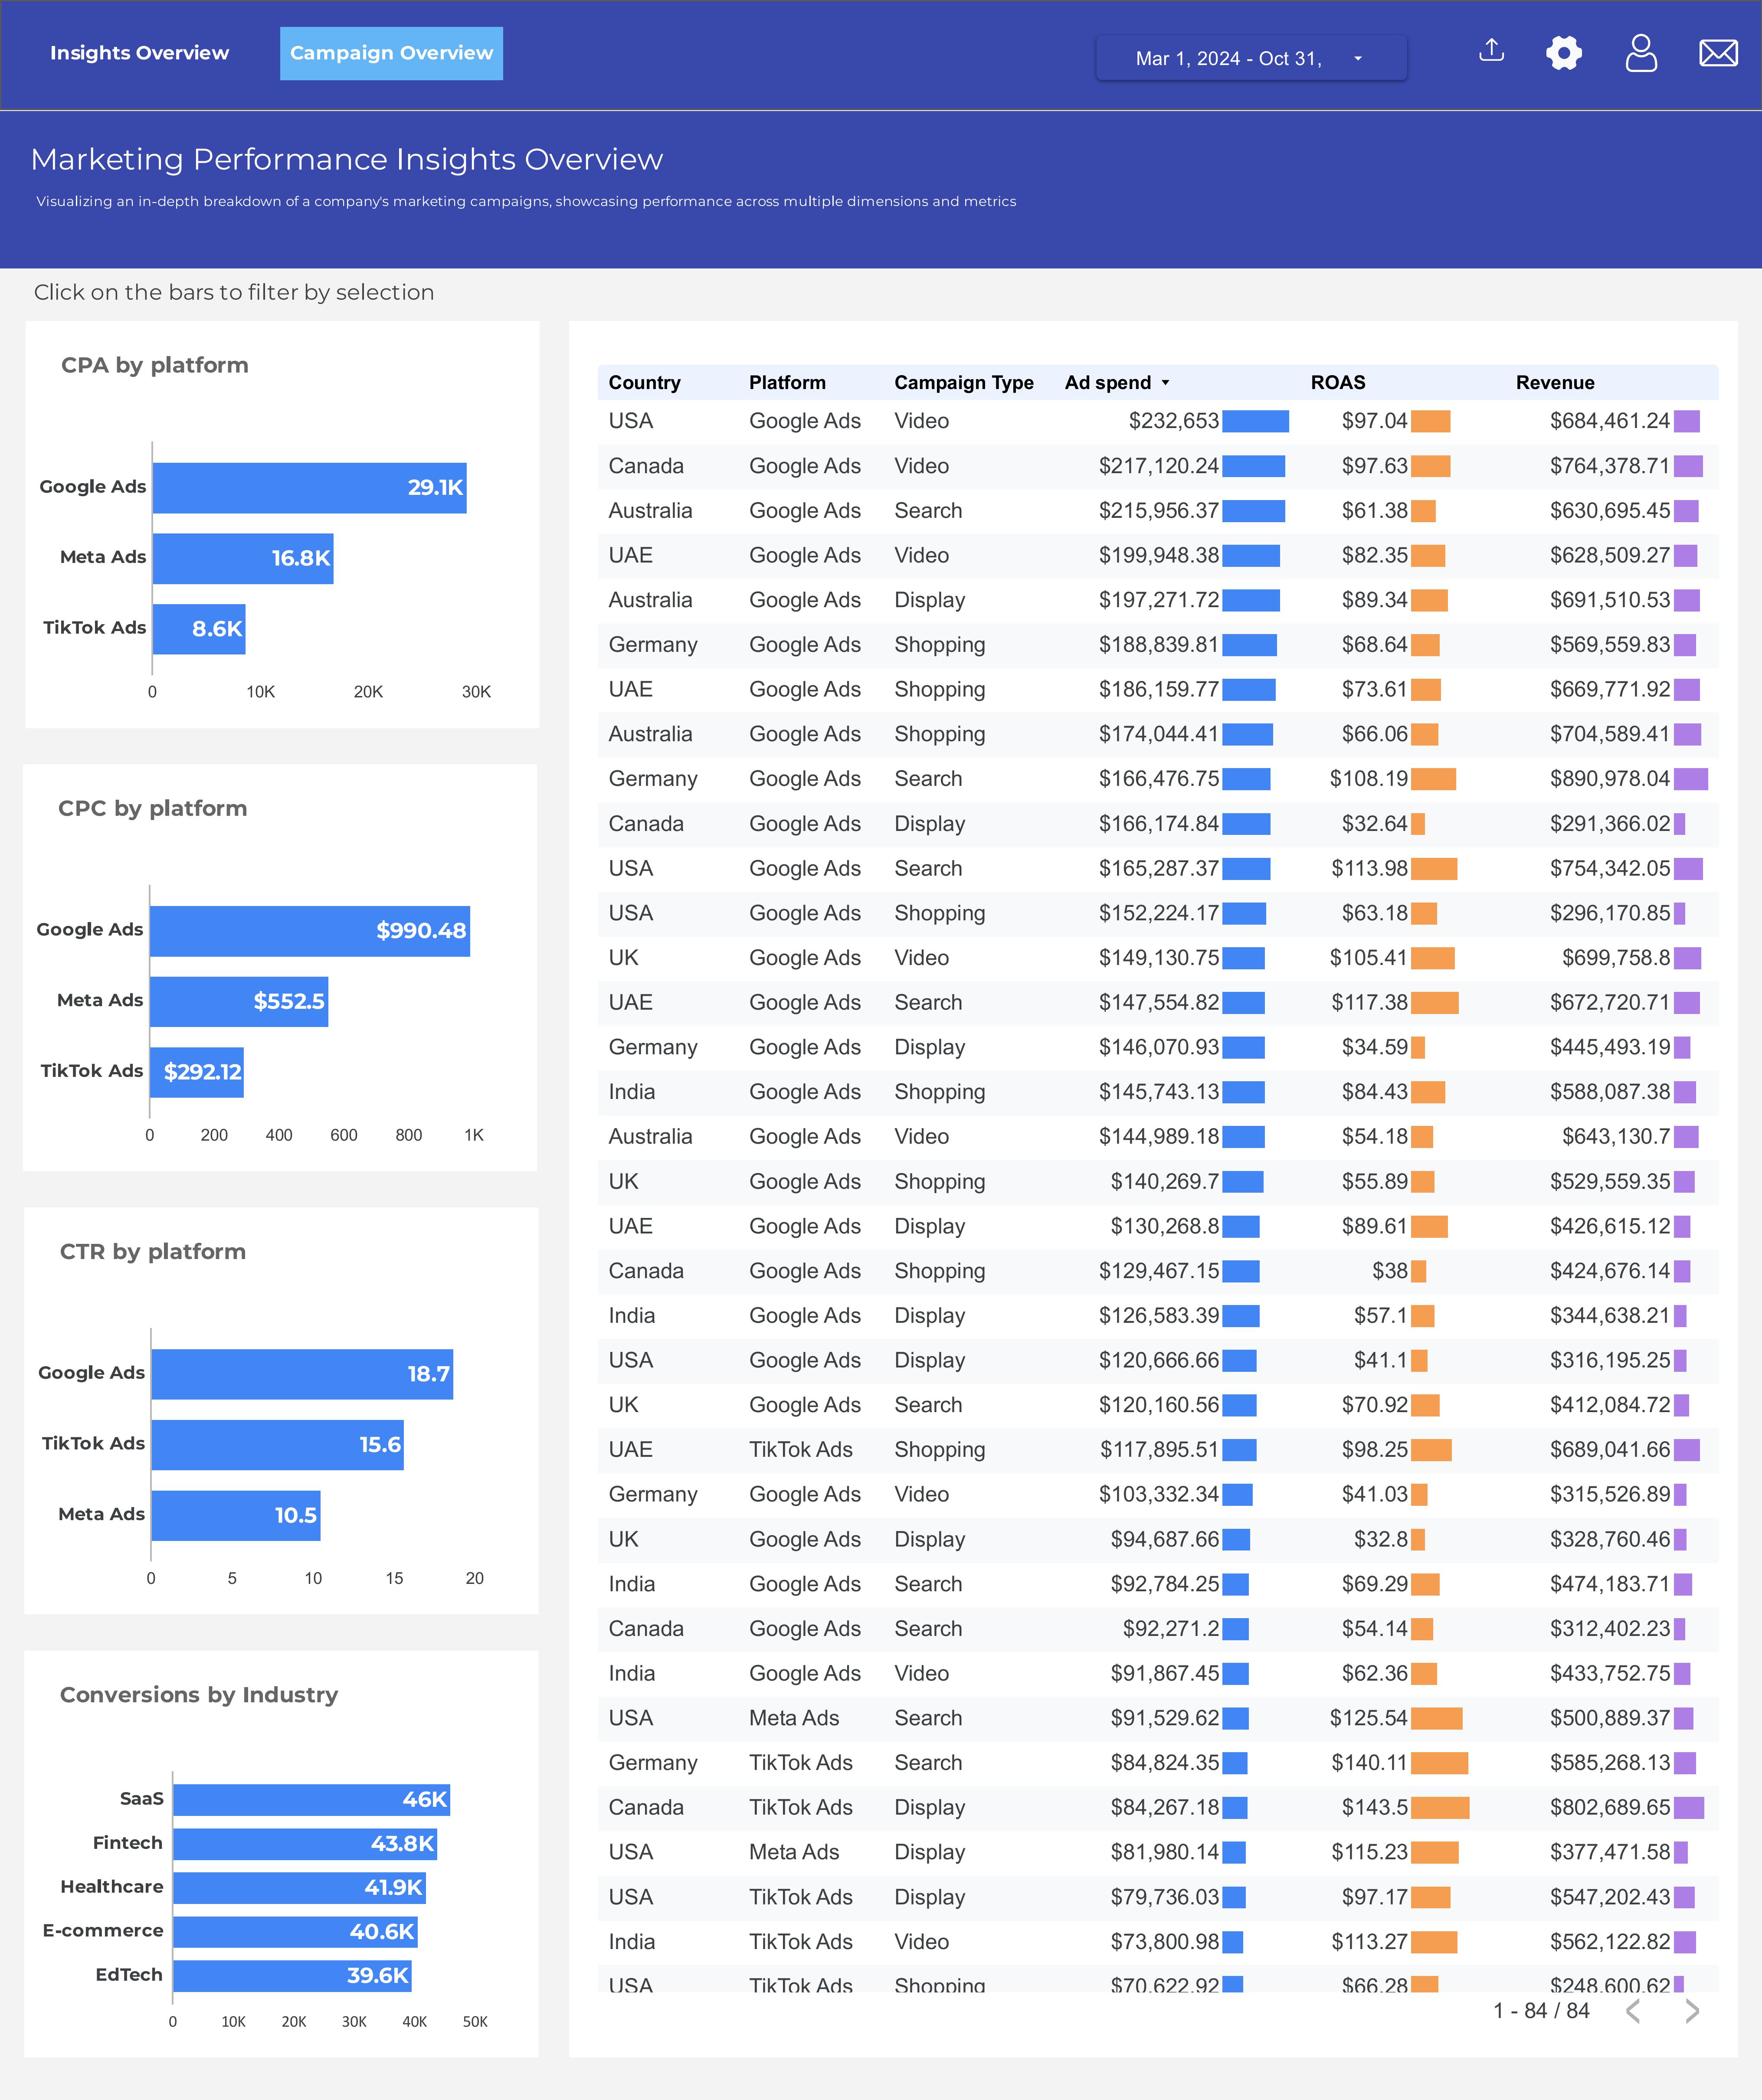
An interactive Looker Studio dashboard designed to evaluate advertising campaign performance, providing insights into ad spend, return on advertising spend (ROAS), campaign types, impressions, and other campaign performance indicators.
Project overview
An interactive Looker Studio dashboard designed to evaluate advertising campaign performance, providing insights into ad spend, return on advertising spend (ROAS), campaign types, impressions, and other campaign performance indicators.
Approach & tools
Advertising data was organized into interactive KPIs and visualizations to assess campaign effectiveness and return on investment. The dashboard enables users to compare campaign types, monitor advertising spend, analyze impressions, and evaluate performance using ROAS and other key indicators.
Looker Studio · Data Visualization · Dashboard Design
Project impact
The dashboard provides a centralized view of advertising performance, helping users understand how campaign spend translates into results, compare campaign types, identify stronger-performing campaigns, and support more informed marketing decisions.
Explore the work
Open the project repository to review the analysis, dashboards, and supporting files.
Start a conversation
Have a data question or project in mind?
Let’s talk about the problem you’re trying to solve and how data can help.